Dashboard layout
The dashboard is designed to provide a comprehensive view at a glance and is structured into several key sections depending on the deployment mode—provisioned or serverless.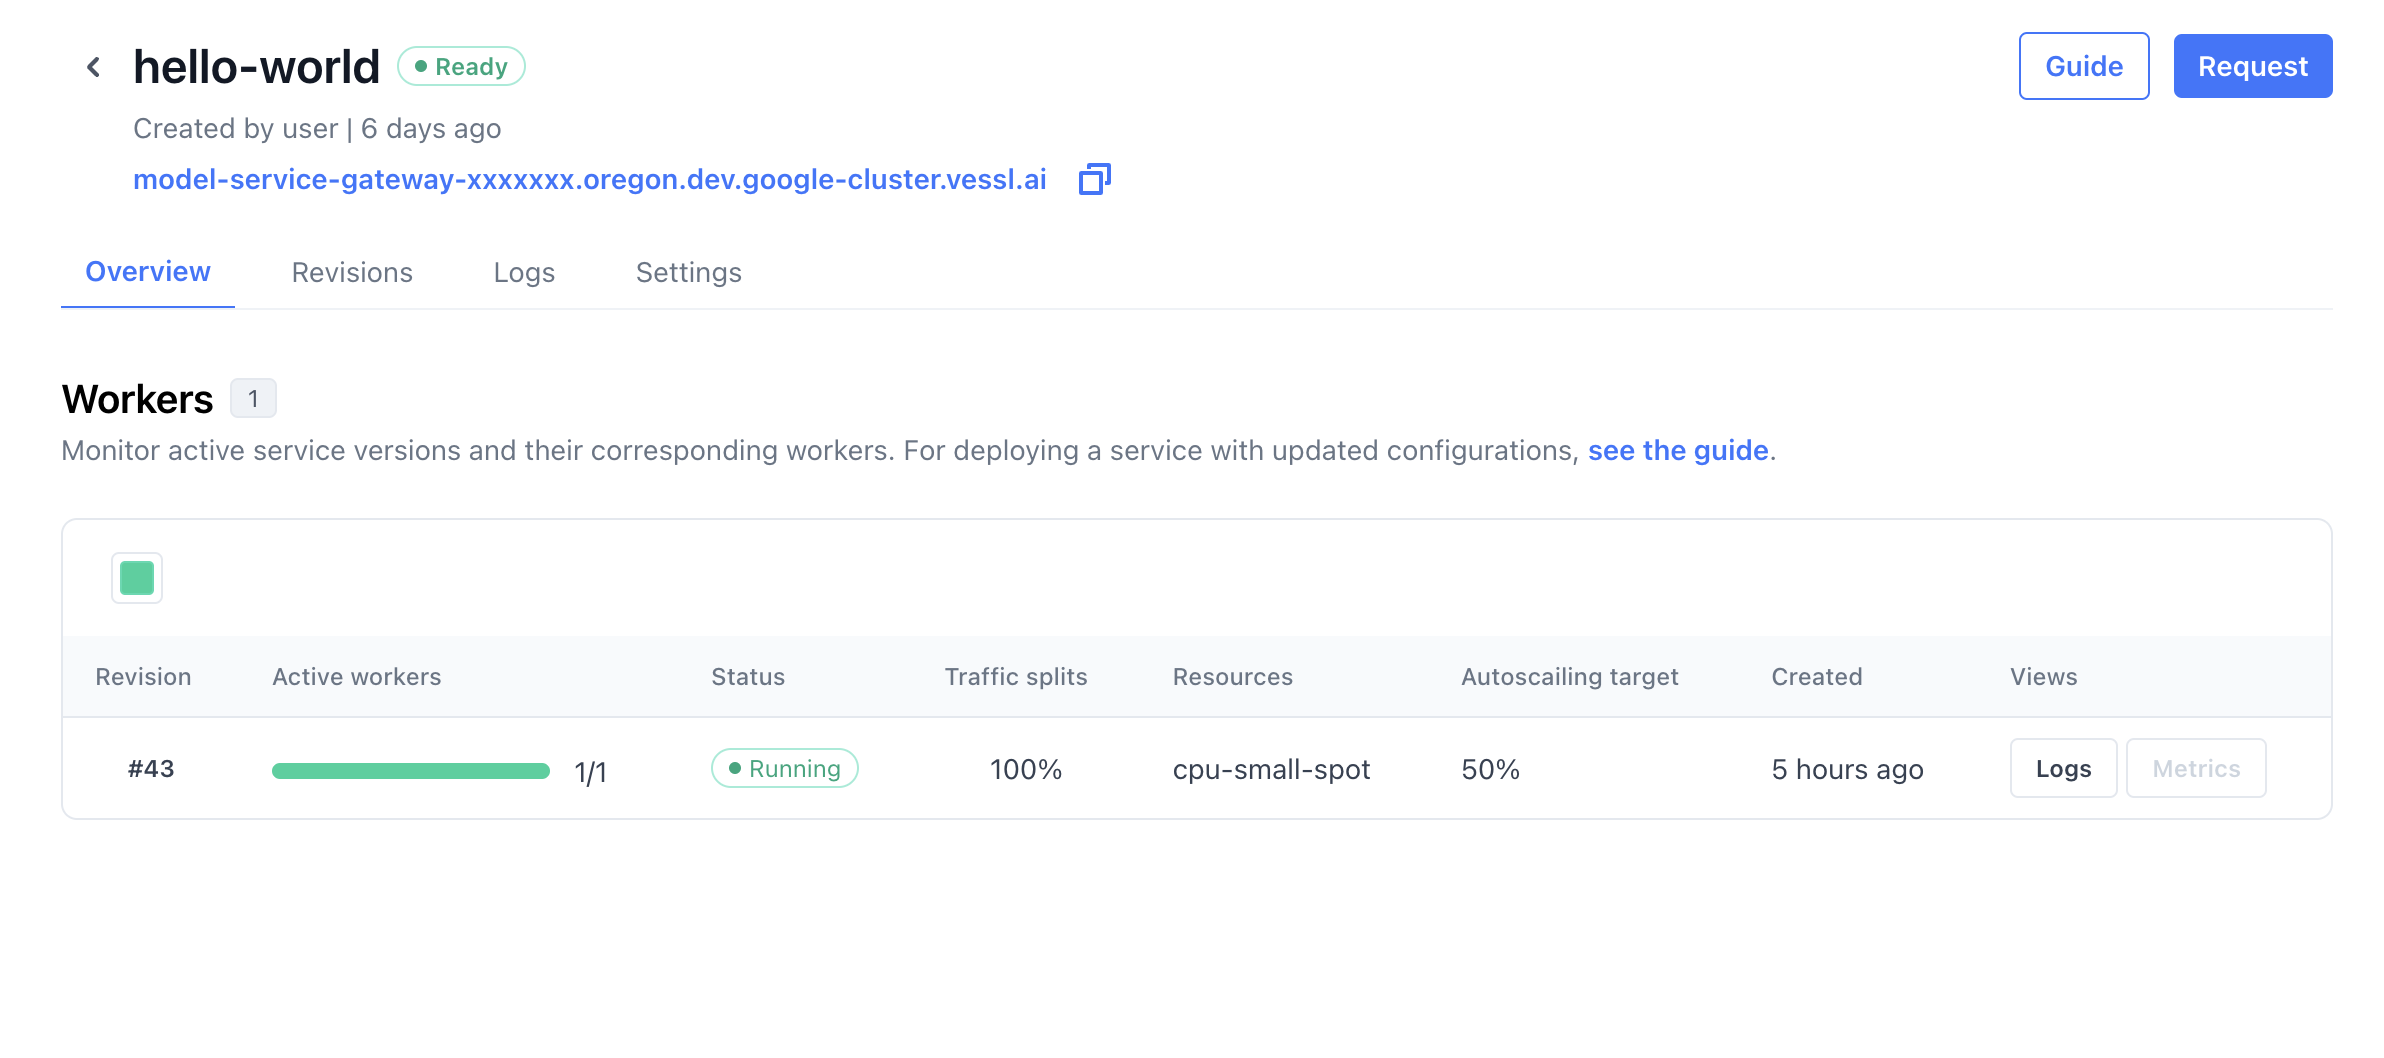
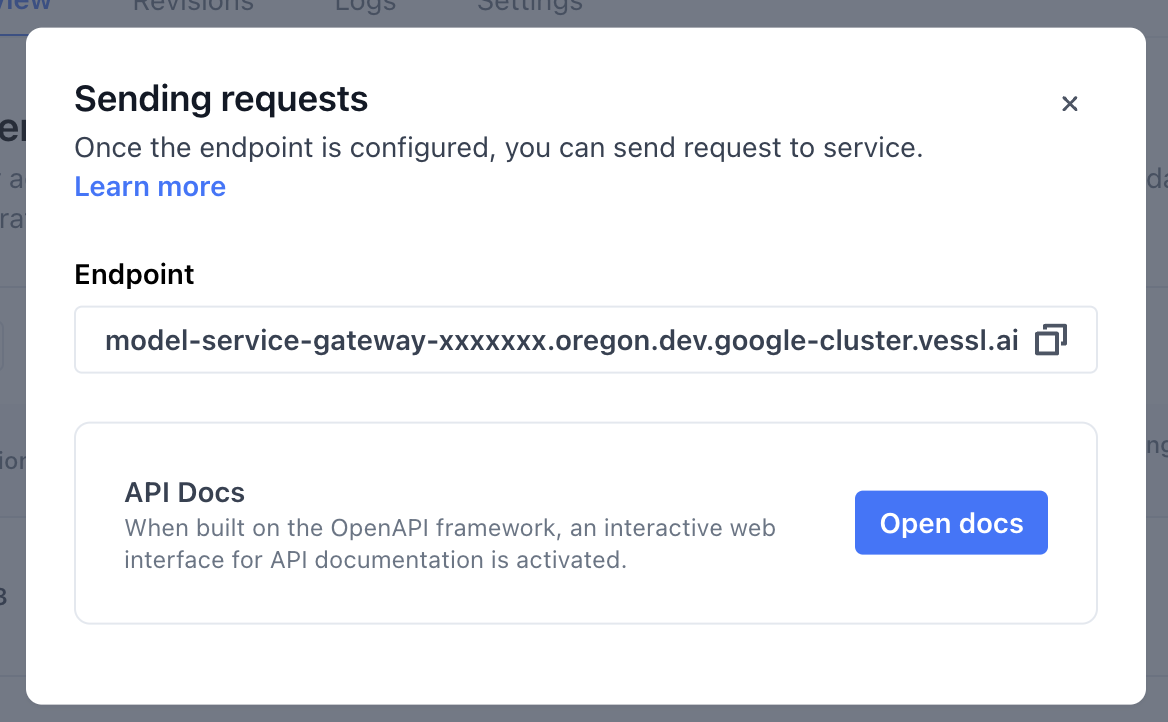
Upper region
This area displays the activated endpoint for the service, which is consistent across both deployment modes.
Workers
The Workers section provides a hostmap view of the current state of the service’s revisions and workers.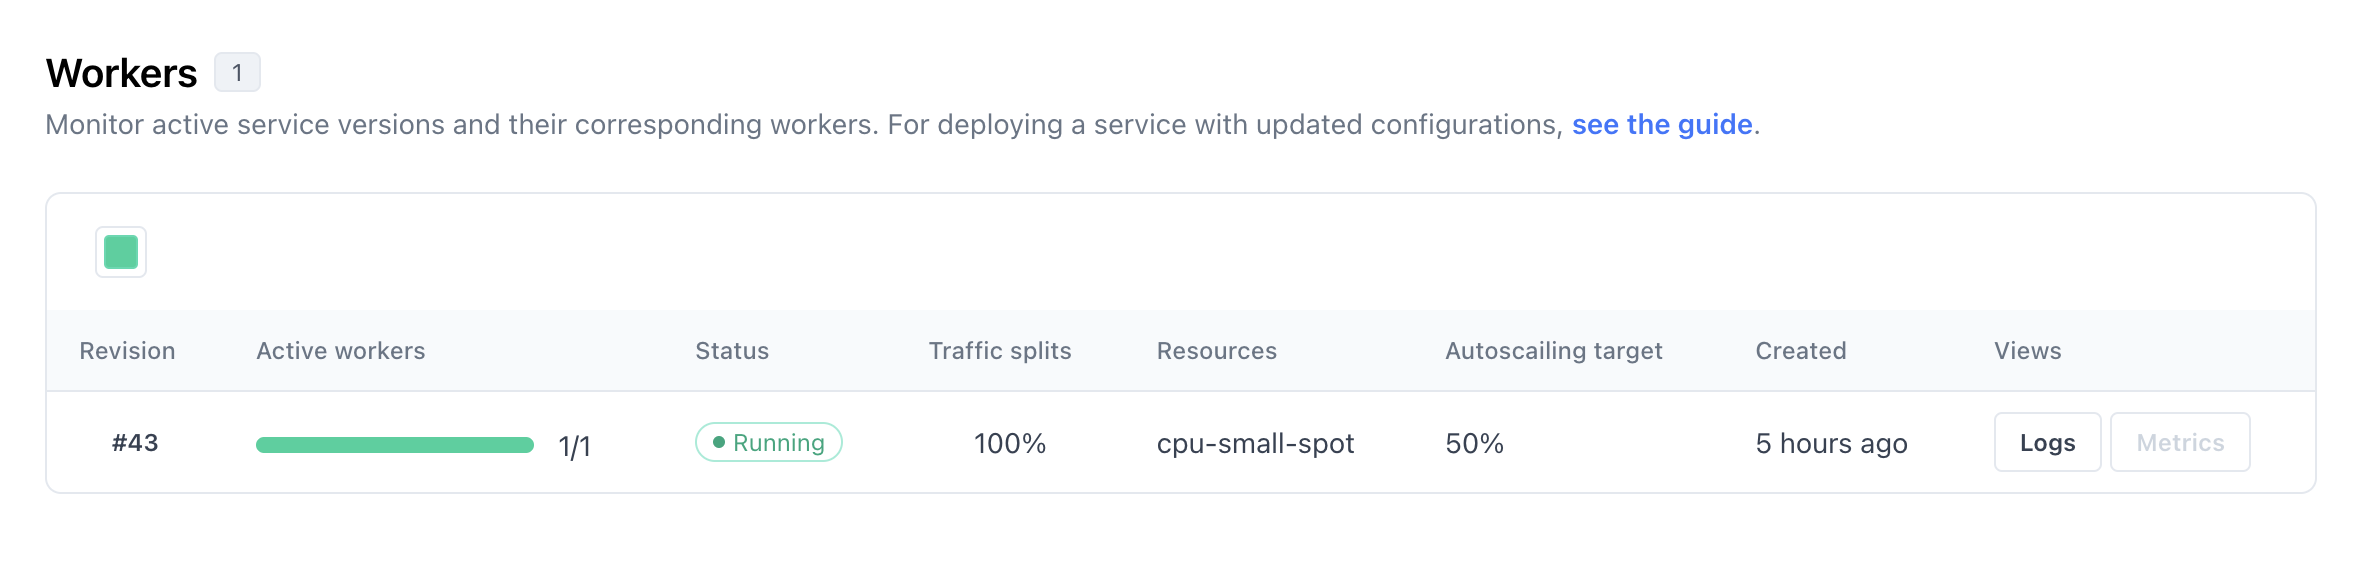
- Provisioned Mode: Display the details of service revision, view logs, filter metrics on the dashboard graphs, and manage the workers serving each model.
- Serverless Mode: Note that autoscaling configurations are not modifiable in this mode.
Revision Tab
Learn how to manage revisions.
Metrics
Metrics tracking is available in both modes but includes additional metrics for queue in Serverless Mode: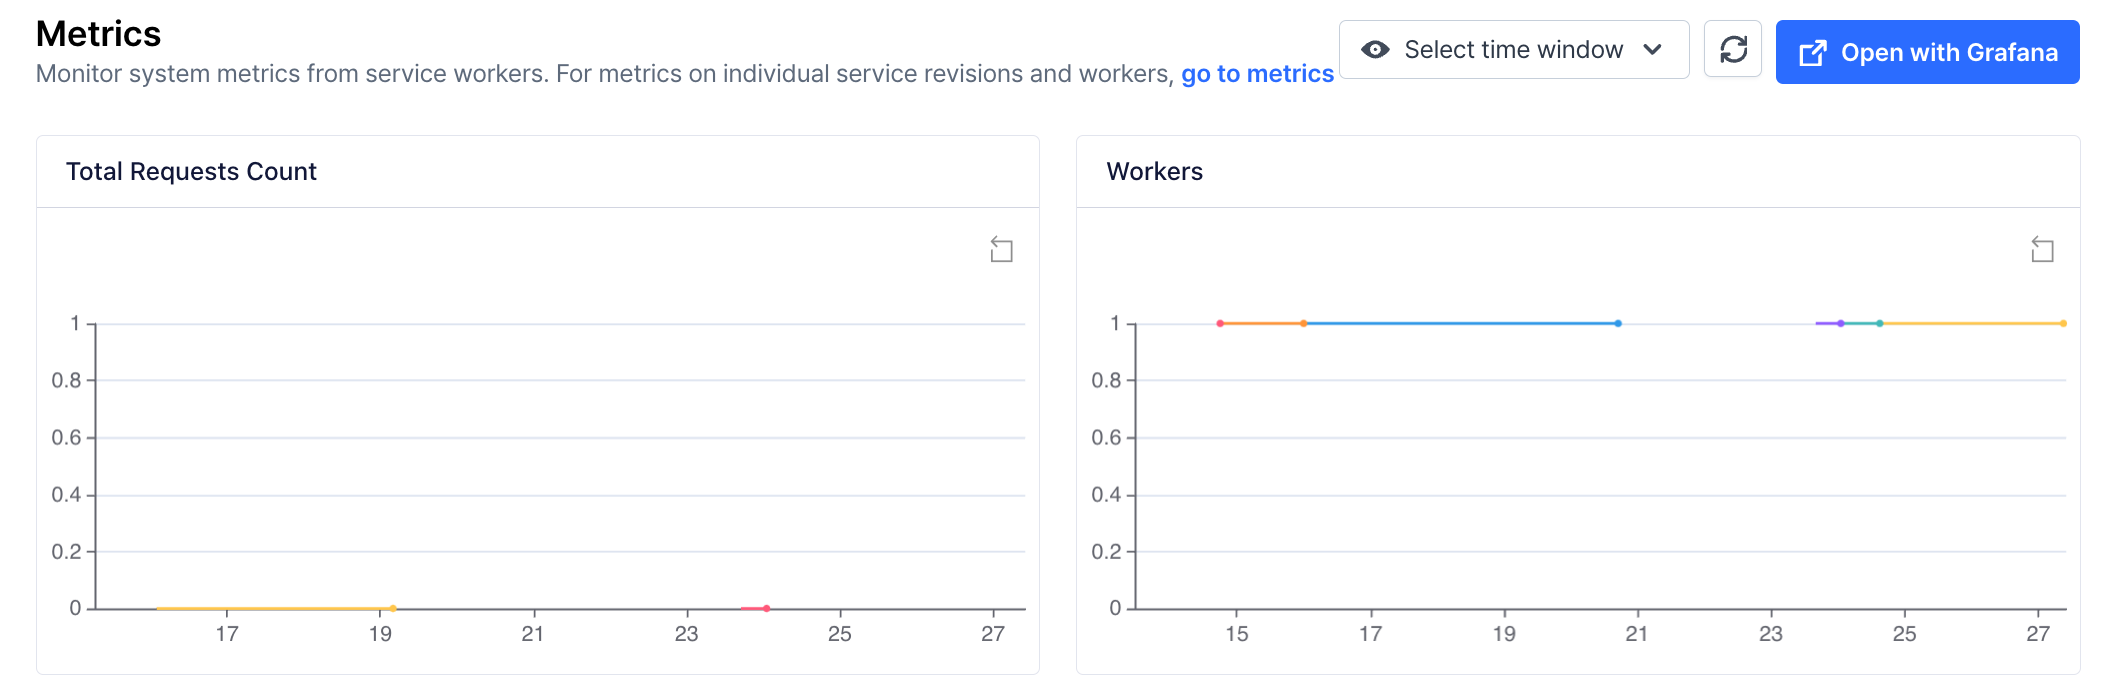
- Provisioned Mode: Key service metrics such as autoscaling and request counts.
- Serverless Mode: Autoscaling and queue length.
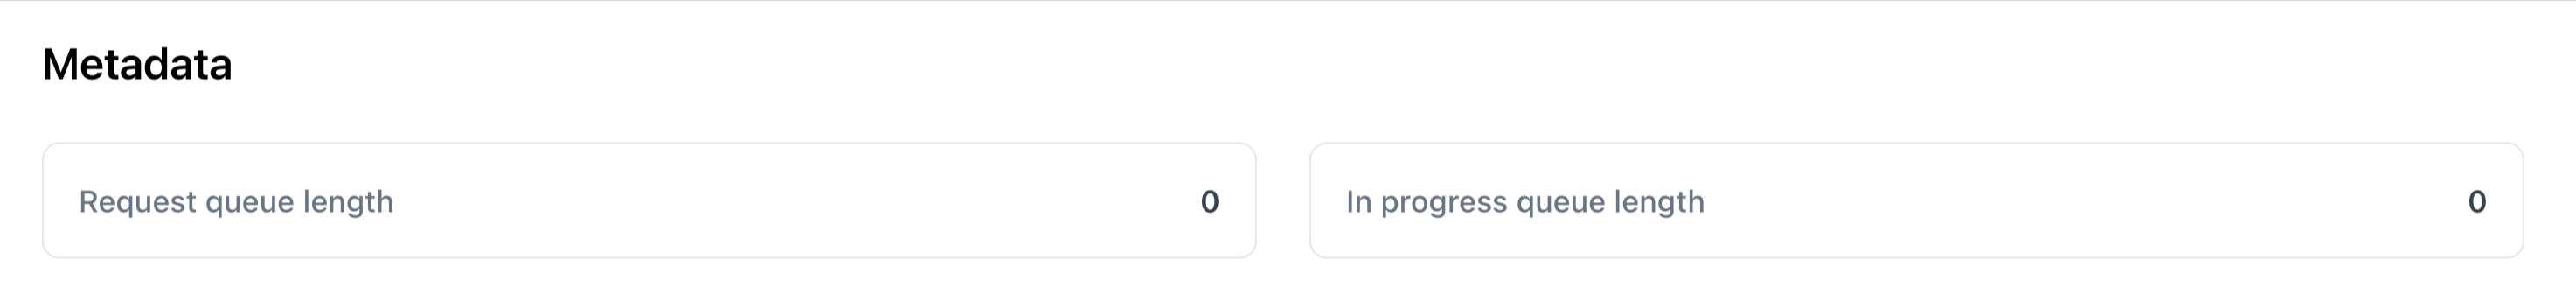
- Request Queue Length: The number of requests waiting to be processed. It is limited to 1000 requests. If you need more capacity, please contact our sales team.
- In Progress Queue Length: The number of requests currently being processed.
Metrics Tab
Display details of system metrics